1MW+ Commercial Solar
At a megawatt the roof or field is rarely the problem. The connection is. Type B rules under G99, a longer study and possible reinforcement set the pace long before the panels do.
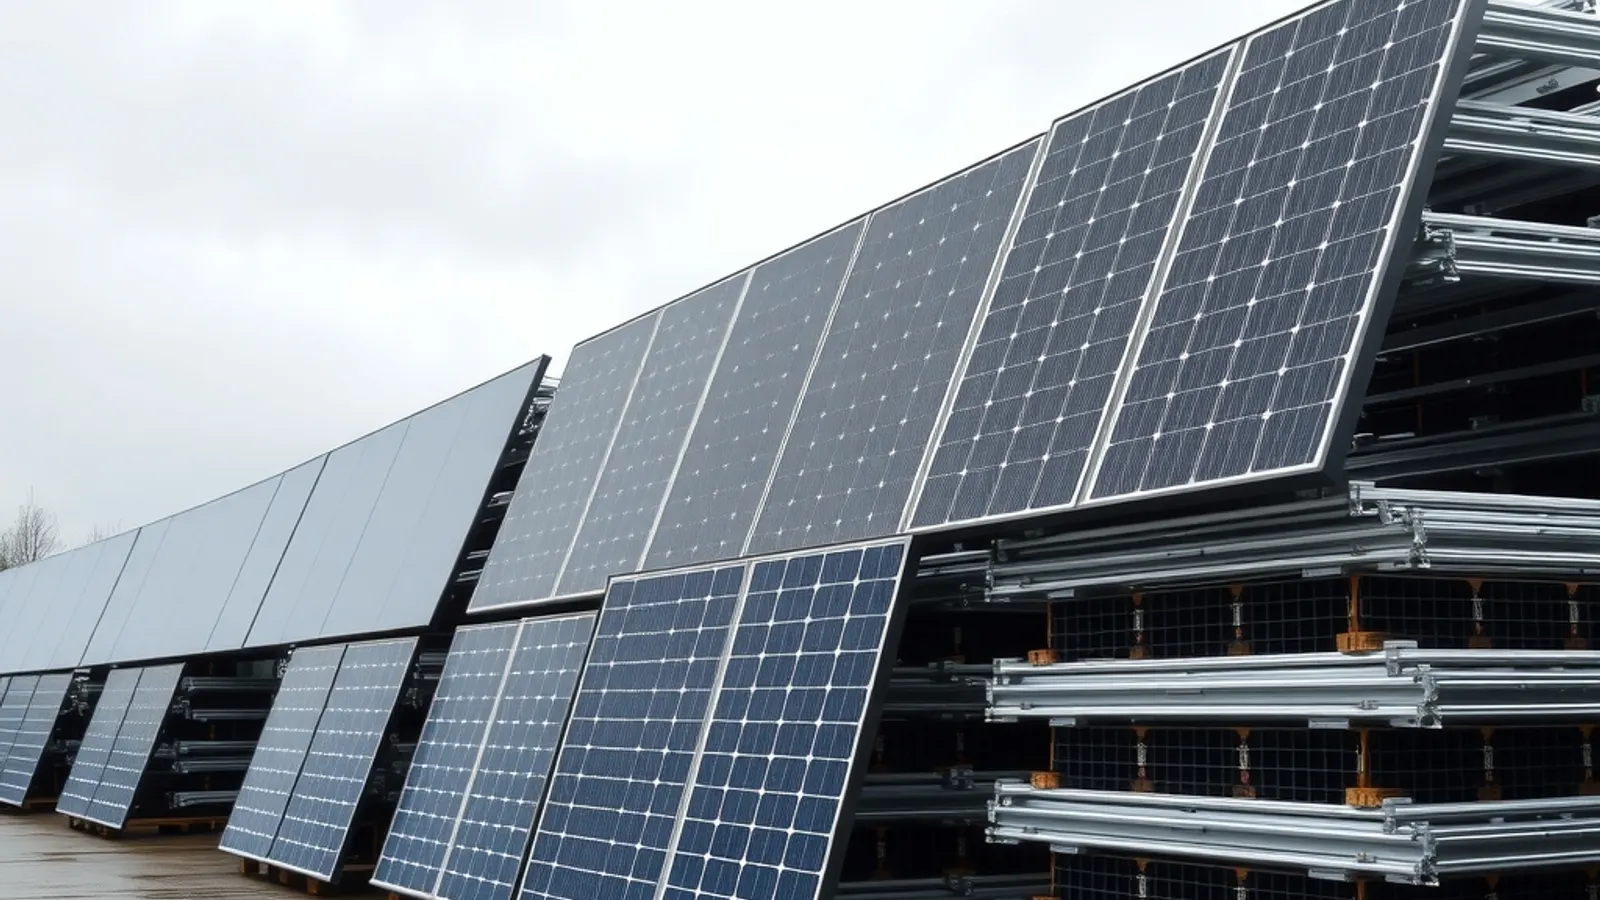
The largest published benchmark is the Arup study for DESNZ, dated July 2025. For large-scale solar over 5 MWp it gives total capital cost of £526 per kWp at the low end, £659 at the middle and £788 at the high end, in 2023 prices. A 1 MWp system lacks that scale. Our planning range of £550 to £800 per kWp therefore sits around the study's figures. Treat it as a starting point and collect firm quotes.
The connection is the critical path. Under G99, a generator of 1 MW or more is Type B, not Type A. That brings extra technical requirements, a fuller study by the network operator and a longer wait. Reinforcement cost cannot be known until the study is done, so the business case should carry an allowance for it from the start. Ofgem's December 2025 update on connections proposed tougher action on operators that miss deadlines, so check where those proposals stand when you apply.
Exports are still worth planning. The Smart Export Guarantee covers solar up to 5 MW, so a 1 MW scheme is eligible, and each supplier sets its own rate. Self-use still drives most of the return. DESNZ shows a 2025 average price of 25.4p per kWh for users of 2,000 to 19,999 MWh a year, lower than for smaller users, so the saving per unit is smaller at this scale.
The tax allowance needs the most planning in this band. With other capital spending in the year, a system costing £550,000 to £800,000 can cross the £1 million annual limit. The excess earns a 50% first-year allowance for a company, and the balance is written down at 6% a year.
Where a business has several sites of this size, the order in which they are built matters for connection dates and for how the allowance is used from one accounting year to the next. That is a portfolio decision and is worth taking as one.
Worked example: 1 MWp at a Peterborough manufacturing campus
A megawatt-scale sketch for a campus with several buildings. It shows how the sums work, while results on a real site will differ.
- Yearly output
- About 1,036,000 kWh (PVGIS, Peterborough: 1,036 kWh per kWp)
- Cost
- £550,000 to £800,000 as a planning range
- Low-use year
- 60% used at 17.8p a kWh is worth about £110,300
- High-use year
- 85% used at 22.8p a kWh is worth about £201,000
- Payback
- Between 3 and 7 years, if the connection carries no reinforcement charge
Prices are 70% and 90% of the DESNZ 2025 average of 25.4p for businesses using 2,000 to 19,999 MWh. Reinforcement charges, servicing, inverter renewal, ageing, export income, finance and tax are all left out, and the first of those can change the answer.
Sources & further reading
- DESNZ and Arup — Onshore wind and solar PV generation cost assumptions (July 2025)
- Energy Networks Association — G98 and G99 connection guides and forms
- Ofgem — update on the connections end-to-end review (December 2025)
- Ofgem — Smart Export Guarantee
- GOV.UK — Annual Investment Allowance
- GOV.UK — Full expensing and 50% first-year allowance
- DESNZ 2025 electricity prices, users of 2,000 to 19,999 MWh (table 3.4.1)
- PVGIS yield model, Peterborough
Frequently asked questions
What is the biggest risk at 1 MW?
Usually the grid connection. Type B rules, the operator's study and a possible reinforcement charge can add months and cost. We price them in at feasibility stage.
We have several sites of this size. How should we sequence them?
As a portfolio, because the build order affects connection dates. Rank the sites on return and ease of delivery. Then order them around connection dates and the way the Annual Investment Allowance is used from year to year. See our portfolio optimisation service.
Insights on cost and returns
Planning a megawatt scheme?
Tell us the site, the supply voltage and any earlier talks with your network operator. We will outline the connection route.