Portfolio Optimisation
With dozens of buildings the question changes from 'does solar work here?' to 'which sites go first?'. We score each site the same way, order the roll-out and set the standards that hold cost and quality steady.
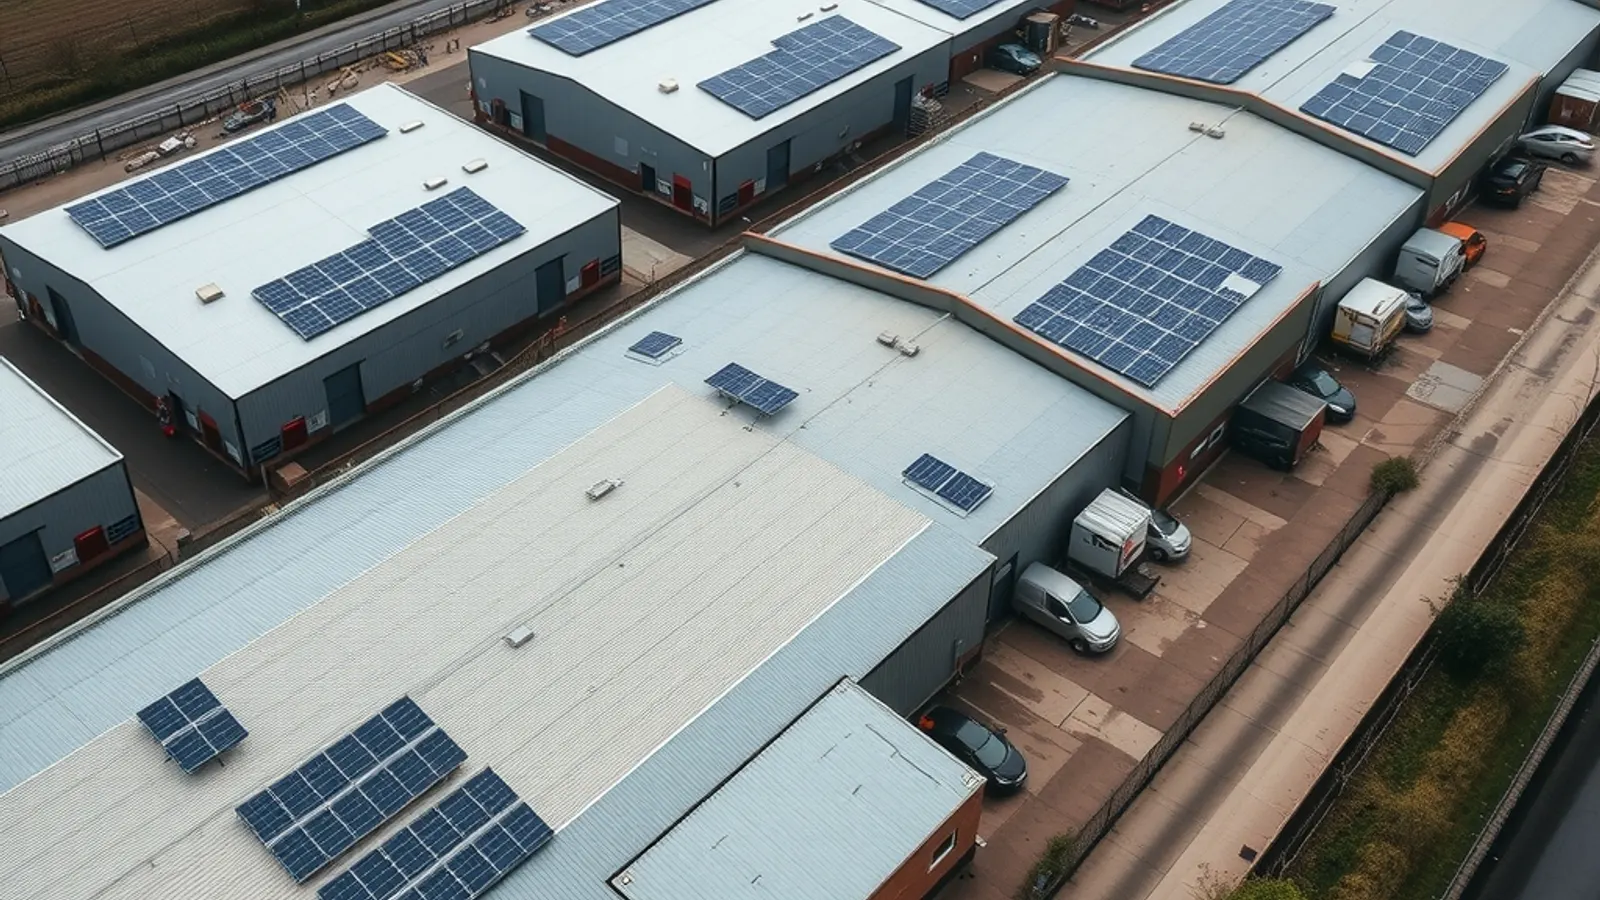
With dozens of buildings, the question changes. It is no longer 'does solar work here?' but 'which sites go first?'. A good answer needs the same data for every site, scored the same way.
Location alone moves the output a long way. PVGIS puts one kilowatt-peak of south-facing panels at about 1,050 kWh a year in Exeter and 810 in Inverness, a gap of almost a quarter. A 100 kWp roof therefore makes roughly 105,000 kWh in one place and 81,000 kWh in the other, before shading or roof pitch is counted.
Yield is only one input. Roof condition, remaining lease, daytime load and the local network all change the ranking. A sunny site with a full local network and a tenant leaving in two years can rank below a duller one with a long lease and spare capacity.
Most programmes underestimate grid timing. An estate usually spans several network operators. Each has its own application process and its own spare capacity. A programme across three operator areas has three queues. Ofgem's December 2025 update says it wants standard connection processes and firmer action on delays. Until that arrives, we plan each site's connection date on its own evidence.
Lease and energy-rating rules shape the order too. Since 1 April 2023 an EPC rating of E has been the minimum for all privately let non-domestic property. A let unit rated F or G needs action, solar or not. Solar can help a rating, so the two programmes can run together.
Standardising pays off once the first sites are built. A single specification and a framework call-off mean later sites price against known rates, and an outlier quote stands out. After switch-on, one reporting format across the estate shows which systems perform to the model and which need a fix.
What it delivers
- A like-for-like score for every site on return and deliverability
- A phased plan tied to capital budgets and lease events
- One specification and a framework route for all sites
- Connection dates planned site by site, by network operator
- Estate-wide performance reporting once the systems run
Outcomes
- Capital directed to the best sites first
- One standard instead of forty different installs
- A single view of output and savings across the estate
Sources & further reading
Frequently asked questions
We have dozens of sites. Where do we start?
We screen the whole estate on the same data and rank the sites. Then we plan the order around your capital and lease dates.
Can delivery be standardised across sites?
Yes. A common specification and a framework route mean each site is bought and built to one standard.
Insights on portfolio optimisation
Multi-site retailers: how to sequence a solar rollout
How a retail chain can order a store-by-store solar rollout, for example by ranking stores and matching tranches to tax relief, grid timing and EPC and ESOS dates.
Read more →Solar for warehouses and logistics: what decides whether a big roof pays
A large warehouse roof is a strong start for solar. Still, three checks decide the outcome: the roof structure and covering, grid capacity, and how much power you use on site.
Read more →Managing a multi-site estate?
Tell us how many sites you hold and how they are let. We will outline how to screen them.