Worked example: a 40,000 sq ft warehouse
A sample distribution warehouse with a big flat roof and steady daytime demand. We walk through the sums step by step, using stated assumptions you can swap for your own.
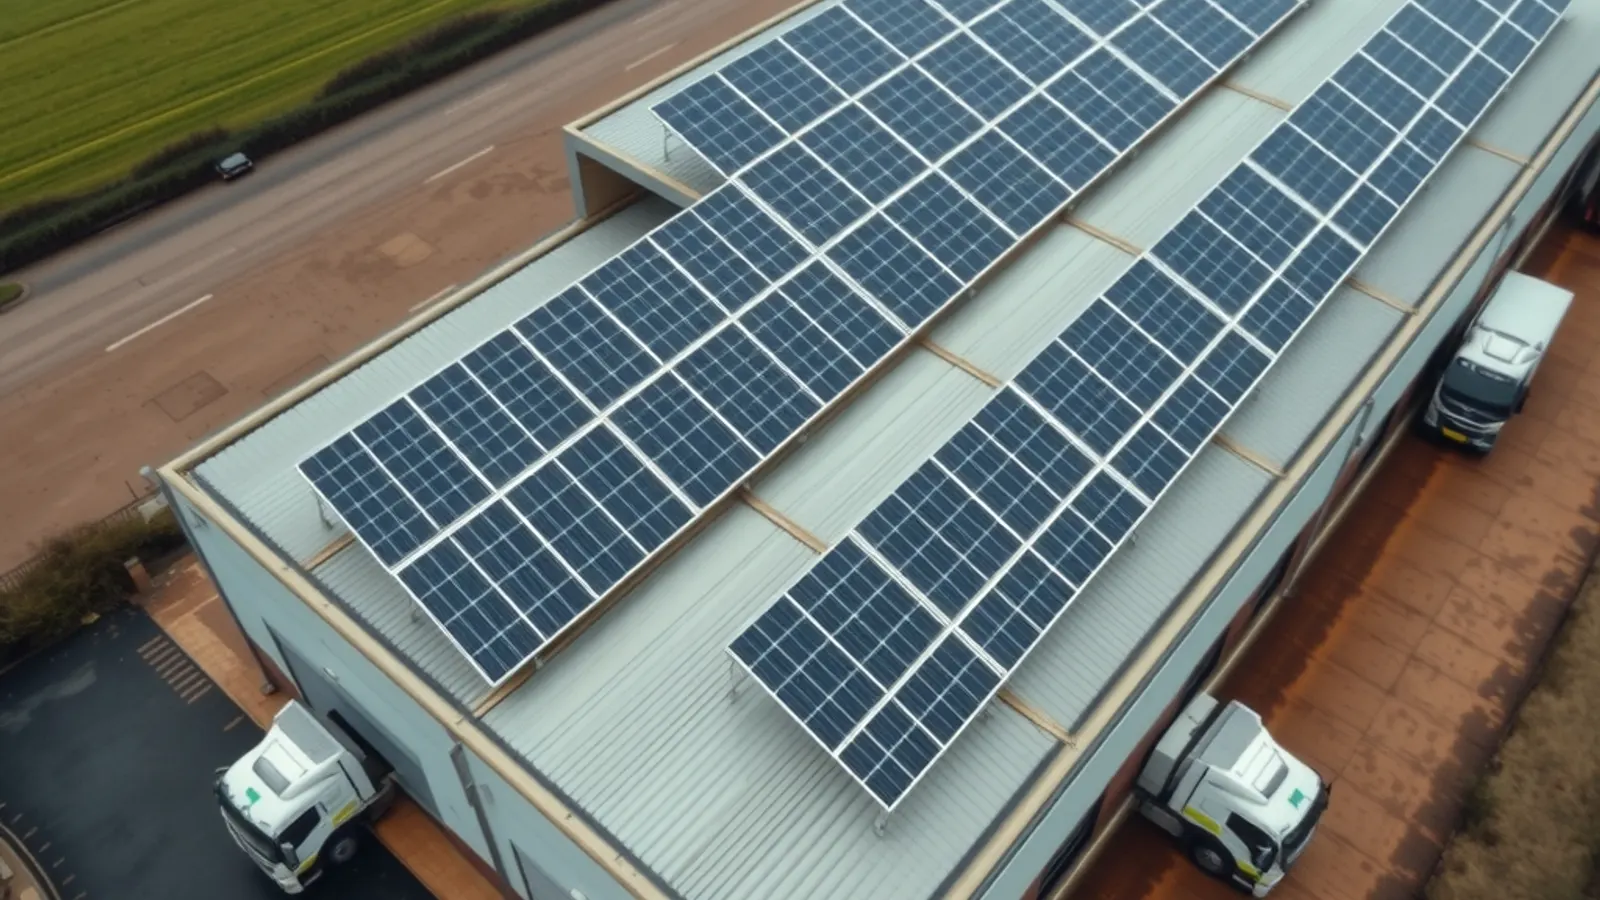
Worked example, not a client: this sample site and every figure on this page are made up to show the method. The inputs are listed below as assumptions. Swap in your own and the answer will change.
This is a worked example, not a client. The site, the figures and the result are all made up to show the method. Change the assumptions and the answer changes with them, because the sums use nothing else.
Picture a single-let warehouse of about 40,000 sq ft in the Midlands. It has a steel frame and a shallow roof. Chillers, conveyors and charging forklifts, for example, draw power all day, five or six days a week.
That steady daytime load is the key fact. Solar power you use yourself saves the full price on your bill. However, power you export earns only the Smart Export Guarantee rate your supplier offers. The rule there is just that it must be above zero.
Before any sums, the roof has to pass. A survey checks the sheets, the frame and how much extra weight it can carry. If the roof needs replacing in the next ten years or so, it is often cheaper to re-roof first, since lifting the panels later costs money.
The grid comes next. A system this size needs a G99 application to the network operator, and its answer can add cost or delay. We would check this before asking anyone to quote, because a quote without it can mislead.
Then the money. The sums below use only the assumptions in the table. They show a short payback on paper. Yet they also show how fast that payback slips if the site uses less of the power.
The assumptions
| Array size | 400 kWp (assumed to fit the usable roof) |
|---|---|
| Yearly yield | 900 kWh per kWp (assumption; check your postcode in PVGIS) |
| Share used on site | 80% (assumed from a steady daytime load) |
| Price you pay for grid power | 24p per kWh (assumption; use your own bill) |
| Export rate | 5p per kWh (assumption; SEG rates vary by supplier) |
| Installed cost | £800 per kWp, so £320,000 (assumption, not a quote) |
| Tax position | Company paying the 25% main rate, with the AIA unused |
The sums
- Yearly output: 400 kWp × 900 kWh = 360,000 kWh.
- Used on site: 80% = 288,000 kWh × 24p = £69,120 saved.
- Exported: 72,000 kWh × 5p = £3,600 earned.
- Year-one value: £72,720. Simple payback before tax: £320,000 ÷ £72,720 = about 4.4 years.
- Tax: solar is special rate spend, so full expensing does not apply. The £1m AIA can cover it if unused. At 25%, that relief is worth up to £80,000, so the net cost falls to £240,000 and payback to about 3.3 years.
- Stress test: if only 50% is used on site, the value drops to £52,200 a year (180,000 kWh × 24p plus 180,000 kWh × 5p). Payback before tax then stretches to about 6.1 years.
- Not counted: panel output falling a little each year, a new inverter part way through, upkeep, insurance and any change in power prices.
Rules and tools used
Frequently asked questions
Is this a real client result?
No. It is a worked example with made-up inputs. We publish it to show how the sums work, so you can test a quote against them. It is not a record of any real site.
Why does the share used on site matter so much?
Because a unit you use saves the full grid price, while a unit you export earns only the export rate. In this example that is 24p against 5p. Moving from 80% to 50% use adds almost two years to the payback.
Want these sums run on your own site?
Your roof, your bills and your grid will differ from this example. A feasibility study swaps our assumptions for your real figures before you commit.